Alberta Analysis
Alberta’s new energy outlook: read the baseline before the forecast
The AER’s 2026 outlook combines a 2025 record of activity with projections. Keeping those two parts distinct makes its capital and production numbers more useful.
What matters
- AER’s September 29 release reports Alberta crude oil and equivalent production of 4.4 million b/d in 2025.
- The reported C$32.4 billion capital total spans crude oil, natural gas, oil sands and emerging resources.
- Historical activity and projected outcomes should be read and charted separately.
The Alberta Energy Regulator’s new outlook is valuable as a baseline for asking where the province’s energy sector goes next. Its strongest use is to connect reported activity with explicit assumptions about future markets, rather than treating every number in an outlook as an observed result.
The AER’s September 29 announcement reports that Alberta produced 4.4 million barrels per day of crude oil and equivalent in 2025, a 4% increase. It also reports C$32.4 billion in capital expenditures across crude oil, natural gas, oil sands and emerging resources. The 2026 edition of ST98 combines a review of 2025 with a ten-year market-based forecast.
Start by asking what each number contains
The capital total covers several resource categories. It should not be relabelled as oil sands spending, drilling spending or a service-company revenue pool. Each of those is a narrower question that needs a breakdown.
An investment total and a production total also measure different activities over time. Money can be committed before an asset begins producing. Other spending may support existing operations or replace equipment. Dividing the headline capital figure by annual production does not produce a meaningful project cost or an industry-wide return on investment.
For a contractor, the useful question is more specific: which category of spending could translate into demand for the work it performs, where, and on what schedule? A province-wide annual number offers context; project disclosures and procurement information are needed to establish an actual opportunity.
An outlook is a set of conditional relationships
A forecast is useful because it connects assumptions with possible outcomes. It becomes less useful when its conditions disappear from the presentation.
Imagine a chart with a historical series followed by a projected series in an identical colour and line style. A reader may interpret the continuation as a settled path. A clearer chart changes the line style at the forecast boundary and states the publication vintage. That makes it possible to compare later observations with what the outlook anticipated at the time.
The ST98 report page says later developments are not captured in the publication and can cause outcomes to differ from its projections. This is a practical instruction for anyone using the report: keep the forecast vintage attached to the data and re-examine the assumptions when material events occur.
Production growth needs a project-level explanation
The provincial baseline does not identify the full contribution of every operator, field or facility. A claim about the source of growth needs evidence at the relevant level.
Useful follow-up research would ask whether a change comes from increased output at existing assets, new facilities, improved availability, or a shift in production mix. Each possibility has different implications for equipment demand, labour and infrastructure. The headline alone does not choose between them.
The same discipline applies to emerging resources. Including them in a provincial report demonstrates that they are being tracked; it does not prove that every proposed project is financed, permitted or operating.
Build a monitor that can be checked
A useful tracker starts with three columns: the observed baseline, the forecast vintage and the next observed result. Add units, geography and definitions before calculating a gap.
Then connect the numbers with corroborating evidence. Issuer disclosures can identify changes to company guidance. Regulatory records can establish an approval or application status. Physical production records can show what was delivered after a project or operational change.
The next test is therefore not simply whether the headline gets larger. It is whether the underlying projects, infrastructure and market conditions develop in a way consistent with the outlook’s assumptions. That is the difference between using ST98 as a reference and using it as a prediction of every business outcome.
Original illustrated learning
Build the background
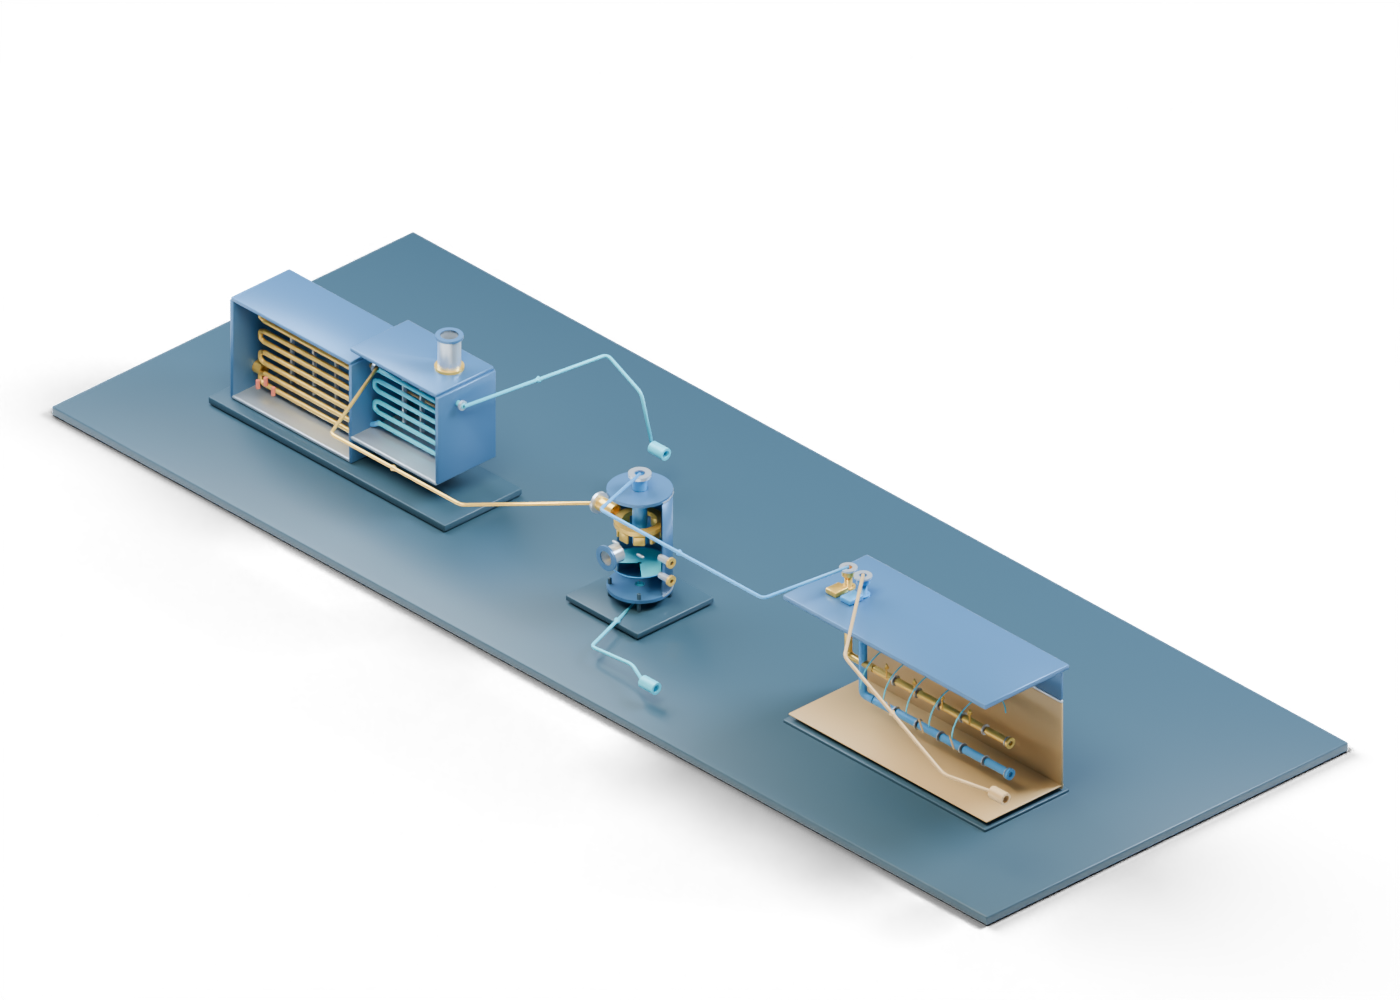
How steam generation, separation and a SAGD well pair fit together
Read the guide
Inside an oil-sands primary separation vessel
Read the guideBefore you compare WTI, Brent and WCS, check what the quote measures
Read the guideThese are original educational concepts, not manufacturer designs, certifications or operating instructions.